
Feature Overview: Tabular View & PDF Export
As well as the Dashboard view which provides an overview of the suburb data (see Search Overview) MarketBuddy provides an easy to read grid based view of the search results.
The grid-based view is particularly useful when doing market reviews as it allows you to see many multiple listings in one table, easily compare important details, and select the ones that interest you. You can then quickly create reports or export your chosen listings to PDF, making it simple to organise your findings and share them tenants and landlords.
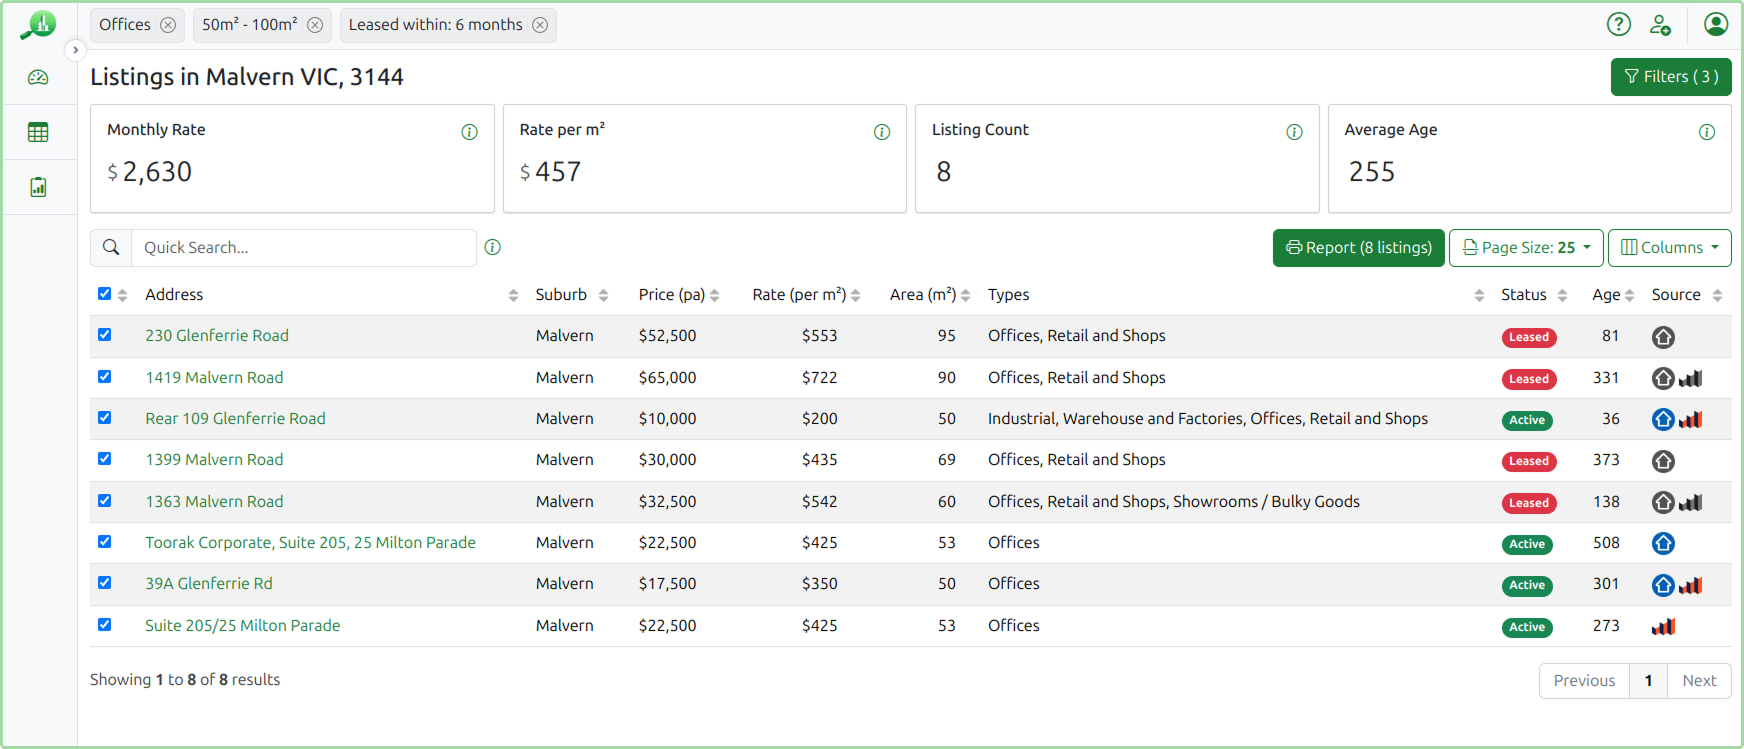
Practical Example: Office Listings in Malvern Victoria
In the below example we are doing a search for Office listings in Malvern between 50m² and 100m². We are also including listings that have been leased in the last 6 months.
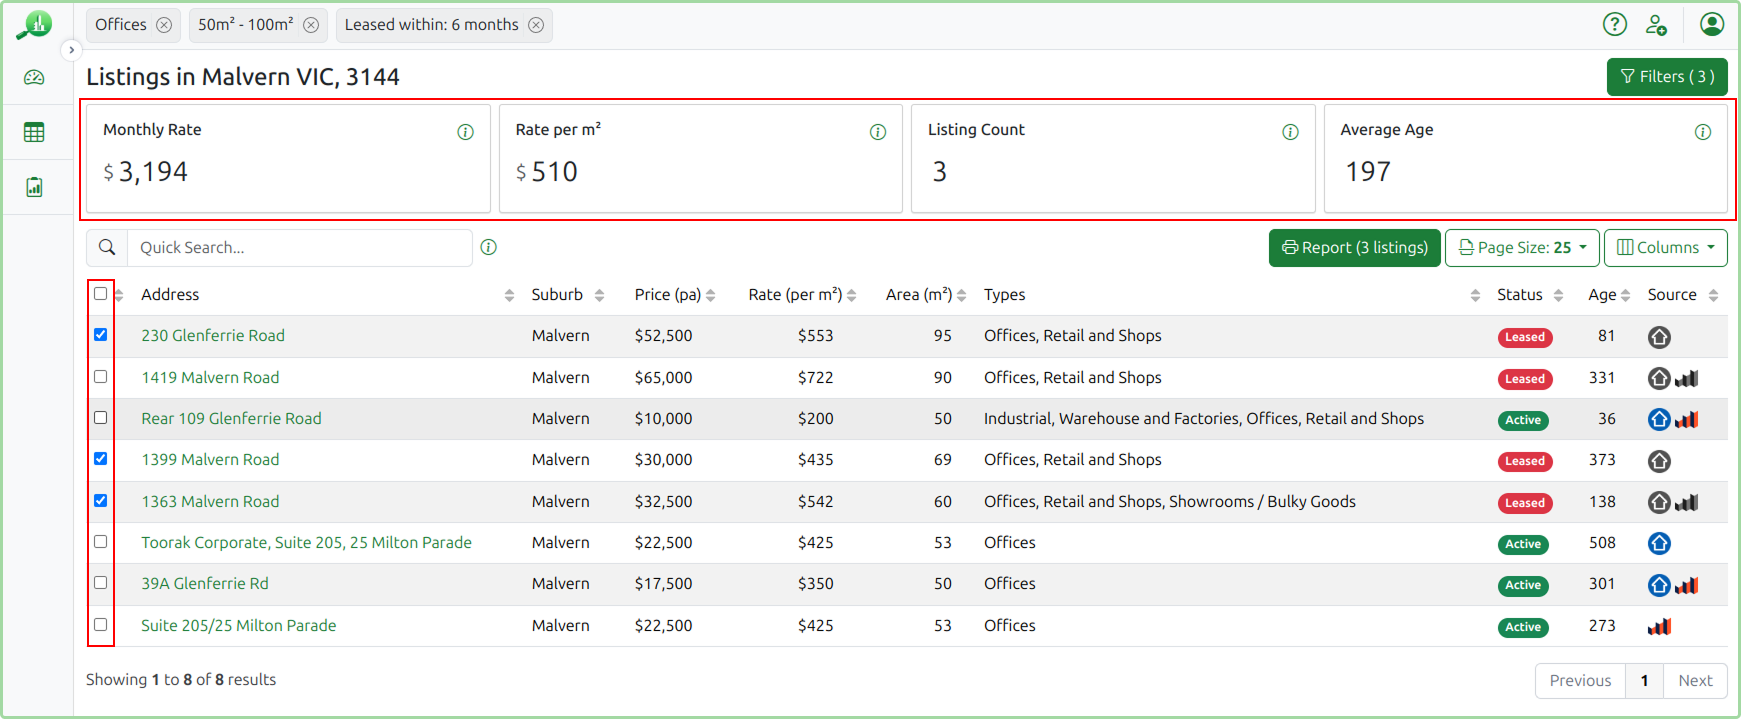
We can use the check boxes on the left of each listing to choose only the listings of interest to us and then using the Report button can generate a report containing the selected listings.
As we select the the listings of interest to us the statistics above the grid including Monthly Rate, Rate per m², Listing Count and Average Age will adjust automatically, accounting only for the selected listings.
Once we are satisfied with the selection we can click the Report button to generate a printable report. This report can then be printed and/or exported to PDF.
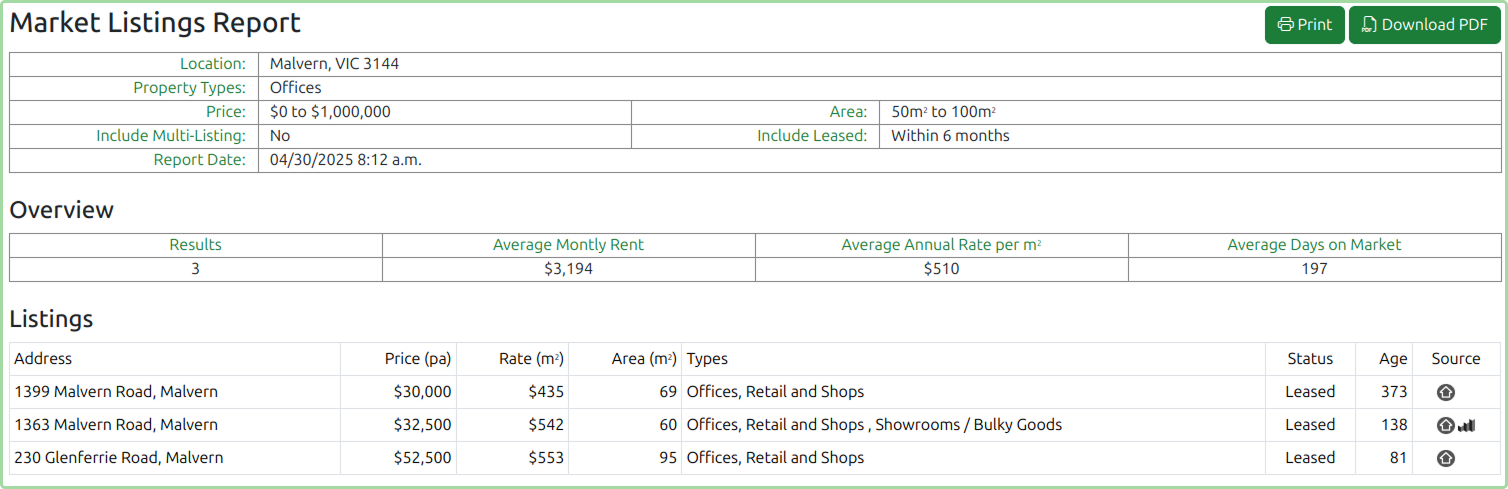
You can download this sample PDF report here.
Summary
The Tabular View and PDF Export features in MarketBuddy make it easy to review, compare, and share listings that are important to you. By allowing you to organise search results in a simple grid, select relevant properties, and generate professional PDF reports in just a few clicks, these tools help you work more efficiently and communicate your insights with confidence.
There are many more features in MarketBuddy designed to simplify your property research and analysis. Sign up today to explore everything MarketBuddy has to offer!